Positions of the players
Taking optimal position is one of the important strategies in tennis. Are there any differences of position between top players?
Data analysis
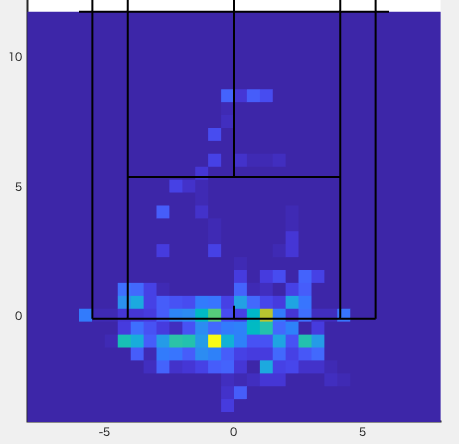
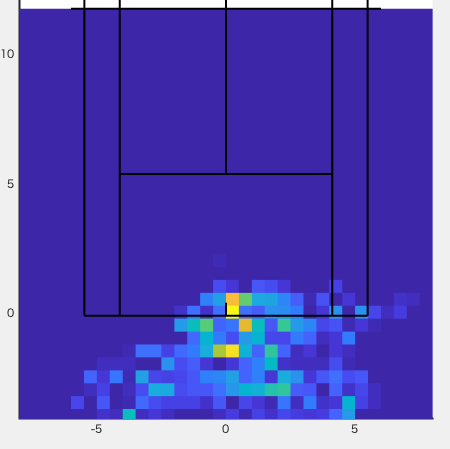
The analyzed match was Australian Open 2017 final “Roger Federer vs Rafael Nadal”. I acquired the positions of the players by a two-dimensional direct linear transformation method. I excluded the points that camera angle was court level view. I focused only the players in the front. Therefore, I analyzed 8 and 11 points for Federer’s serve and return points, respectively. I also analyzed 10 and 12 points for Nadal’s serve and return points, respectively. I visualized the positions of the players by heatmaps (Figure 1 and 2). Yellow square shows high density and blue square shows low density.
Federer

Nadal

Result
Federer’s heatmap looks like inverted triangle and Nadal’s heatmap looks like triangle. The average of the Nadal’s hitting position is 1.60 (±1.57) m behind from the baseline in anterior-posterior direction. The average of the Federer’s hitting position is 0.05 (±1.97) m behind from the baseline. The average of the Nadal’s hitting position is 1.66m behind from that of the Federer’s hitting position.
Discussion
The Nadal’s hitting position was behind from the Federer’s hitting position. What makes this difference?
Importance of position data
There are position differences between players. This result could result from the difference of play styles. Federer is an all-court player and Nadal is a baseliner. All-court player often uses volley shot.
Federer took the 1st set. However, this match was full set. Nadal took 2nd and 4th set. Position data maybe show transitions of strategies during matches. Therefore, it is worth comparing the position data between sets. I check this in future posts.
Limitation
Data sample was small due to the time consuming process of acquiring data by manual digitizing. I plan to automate this process.
Epilogue
I visualized the positions of players by using heatmap.
See you next time!
